


 返回

Small RNAs are a class of short, non-coding RNAs that play crucial regulatory roles in living organisms. Extensive research has demonstrated that small RNAs are involved in the regulation of virtually all biological processes in both animals and plants, including cell proliferation, differentiation, and apoptosis, and they are closely linked to the onset and progression of human diseases. Small RNA sequencing is a technique used to analyze these important regulatory small RNAs—particularly microRNAs (miRNAs)—by employing high-throughput sequencing to identify and characterize 18–30 nucleotide‑long small RNA sequences in a given sample.
Technological Advantages
-
Library Optimization: To address the distinct characteristics of animal and plant miRNA sequences, we have optimized the library‑preparation workflow to maximize the enrichment of small RNA sequences in the sample.
-
Exclusive analysis software: We possess the independently developed data analysis software ACGT101‑miR, whose reliability has been validated by hundreds of experimental studies; the generated figures can be directly used in manuscript preparation.
-
Extensive project experience: One of the earliest companies in China to offer small RNA sequencing services, with users having published over a hundred papers related to small RNA sequencing.
Technical Roadmap
-
Total RNA
-
3’ and 5’ adapter ligation
-
Reverse transcription
-
PCR amplification
-
PAGE purification
-
Next-generation sequencing (HiSeq 2500, SE50)
-
Data analysis
Analysis Content
1. Data quality control: statistical analysis of sequencing quality score distributions; quality control of sequencing base calls; and statistics on sequencing data output.
2. Acquisition of comparable sequencing data
3. miRNA databases and genome alignment of sequenced species
4. Comparison with Other RNA Databases
5. Prediction of novel miRNAs
6. Analysis of miRNA sequences themselves
7. miRNA quantification analysis, differential expression analysis of miRNAs across multiple samples; screening of differentially expressed miRNAs; statistical analysis of differentially expressed miRNAs; clustering analysis of miRNA expression patterns (limited to multi-sample projects).
8. Replicate correlation analysis (limited to biological replicate samples).
9. Prediction of target genes for differentially expressed miRNAs (using TargetFinder for plants and TargetScan and miRanda for animals)
10. GO and KEGG annotations of target genes for differentially expressed miRNAs, along with GO and KEGG enrichment analyses, pathway analysis, and pathway network analysis. (Applicable only to multi-sample projects.)
Target gene GO and KEGG annotations, as well as GO and KEGG enrichment analyses, along with pathway analysis and pathway network analysis for differentially expressed miRNAs. (Applicable only to multi-sample projects.)
Sample Type
Cells, tissues, body fluids, serum, plasma, whole blood, total RNA, etc.
Recommended total RNA input: 5 μg, with a minimum of 2.5 μg; concentration ≥ 120 ng/μL.
Sample Type
1.Wu S, Li Y, Chen S, Liang S, Ren X, Guo W, Sun Q, Yang X. (2017) Effect of dietary Astragalus Polysaccharide supplements on testicular piRNA expression profiles of breeding cocks. International Journal of Biological Macromolecules 103(1), 957-964.
2.Tritten L, Tam M, Vargas M, Jardim A, Stevenson MM, Keiser J, Geary TG. (2017) Excretory/secretory products from the gastrointestinal nematode Trichuris muris. Experimental Parasitology 178(1), 30-36.
3.Sun J, Yao L, Chen T, Xi Q, Zhang Y. (2017) The effect of dietary ginseng polysaccharide supplementation on the immune responses involved in porcine milk-derived esRNAs. bioRxiv [Epub ahead of print].
4.Ghorecha V, Zheng Y, Liu L, Sunkar R, Krishnayya NSR. (2017) MicroRNA dynamics in a wild and cultivated species of Convolvulaceae exposed to drought stress. Physiology and Molecular Biology of Plants 23(2), 291-300.
5.Li H, Peng T, Wang Q, Wu Y, Chang J, Zhang M, Tang G, Li C. (2017) Development of Incompletely Fused Carpels in Maize Ovary Revealed by miRNA, Target Gene and Phytohormone Analysis. Frontiers in Plant Science 8(1), 463.
Case Showcase
Analysis and Comparison of Small RNAs During Pollen Development in Autotetraploid and Diploid Rice
1. Research Background
MicroRNAs (miRNAs) regulate plant gene expression by repressing their target genes and play crucial roles in plant reproduction. However, research on the miRNA profiling of autotetraploid rice remains quite limited.
2. Research Findings
In this study, researchers employed small RNA sequencing to analyze the miRNA profiles during pollen development in both diploid and polyploid rice. The results revealed that, compared with diploid rice, tetraploid rice harbors 172 differentially expressed miRNAs (DEM), along with 57 miRNAs that are specifically expressed in homologous tetraploid rice. Among these 172 DEMs, 115 are upregulated and 61 are downregulated. GO analysis of the target genes of the upregulated DEMs indicates that their functions are enriched in membrane trafficking during pre-meiotic interphase, meiotic reproduction, and nucleotide binding during the uninucleate microspore stage. osa-miR5788 and osa-miR1432-5p_R+1 are upregulated during meiosis; their target genes reveal interactions among meiosis‑related genes and suggest that they may participate in the regulation of genes involved in chromosome behavior. Furthermore, abundant 24‑nt siRNAs associated with transposable elements were identified during pollen development in homologous tetraploid rice; however, their abundance is markedly reduced in diploid rice, suggesting that 24‑nt siRNAs may play a role in pollen development.
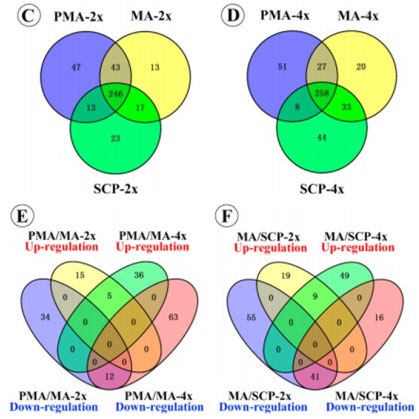
Figure: Venn diagram analysis of miRNA expression at different stages during pollen development.
The findings of this study provide new insights into the roles of miRNAs during pollen development in autotetraploid rice and their relationship with pollen sterility, laying the groundwork for understanding how small RNA expression profiles influence polyploidy.
References
Li, et al. (2016) Comparative Small RNA Analysis of Pollen Development in Autotetraploid and Diploid Rice. International
Journal of Molecular Sciences. 17, 499; doi:10.3390/ijms17040499
Results Display
1. Statistical analysis of differentially expressed miRNAs (upregulation and downregulation)
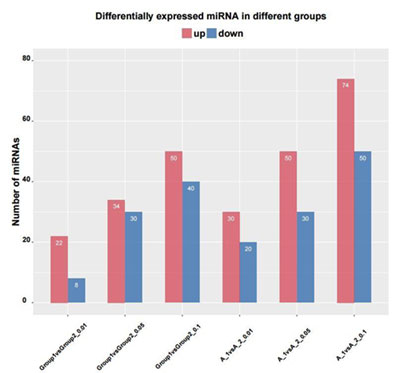
The statistical analysis of the number of upregulated and downregulated differentially expressed genes is used to determine the number of miRNAs with differential expression under various experimental conditions. In this plot, the x-axis represents the comparison groups, while the y-axis indicates the number of upregulated and downregulated miRNAs; red denotes upregulated miRNAs, and blue denotes downregulated miRNAs, with the numbers on the y-axis specifying the respective counts.
2. Differential miRNA Cluster Analysis
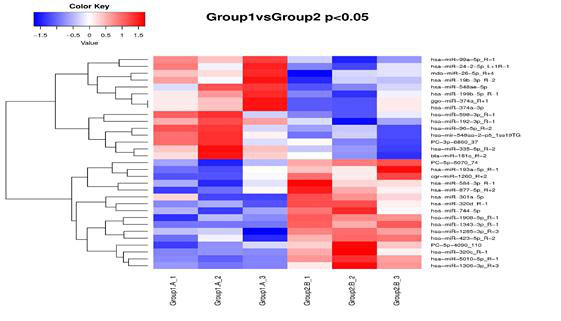
Differential miRNA clustering analysis is used to identify clustering patterns of miRNA regulation under different experimental conditions. By clustering miRNAs according to the similarity of their expression profiles across samples, this approach provides a visual representation of miRNA expression levels in various samples or treatments, thereby revealing biologically relevant insights. Different colors indicate distinct miRNA expression levels, with hues ranging from blue through white to red, corresponding to decreasing to increasing expression. Red denotes highly expressed genes, while dark blue indicates lowly expressed genes.
3. Venn diagram of differentially expressed miRNAs
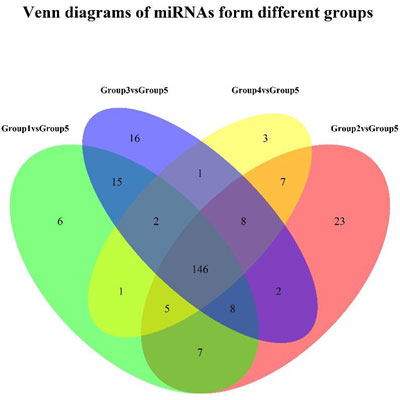
Venn diagrams of differentially expressed genes among various comparison groups can visually illustrate the number of miRNAs that are commonly shared or uniquely specific to each group. Such Venn diagrams carry clear biological significance; for instance, in experimental designs involving the same control but different treatments, they enable direct comparisons of differentially expressed genes across treatment conditions.
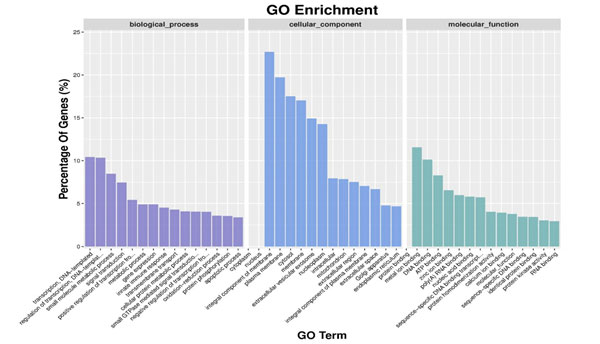
4. GO Enrichment Bar Plot
GO enrichment bar plot of miRNA target genes: used to illustrate the distribution of the number of differentially expressed genes across GO terms enriched in biological process, cellular component, and molecular function.
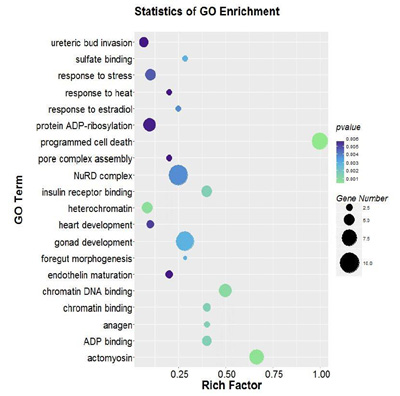
5. GO Enrichment Scatter Plot
GO enrichment analysis was performed on the differentially expressed miRNAs and visualized using a scatter plot. The Rich factor is defined as the number of differentially expressed genes annotated to a given GO term divided by the total number of genes annotated to that GO term; a smaller P-value indicates a stronger GO enrichment.
Frequently Asked Questions
1. What are the naming rules for miRNAs?
Regarding miRNA nomenclature, it follows the miRBase naming convention: species three-letter Latin abbreviation–miR/MIR–number (for animals), with “miR” denoting the mature microRNA and “MIR” used for the precursor in plants. See the official miRBase website: currently, the asterisk (*) is no longer used to indicate the complementary sequence at the pairing site between a microRNA and its hairpin precursor; instead, the suffixes “-3p” and “-5p” are employed to distinguish these two strands, replacing the previous naming scheme. For details, refer to the miRBase database’s blog post released with version 17.0: http://www.mirbase.org/blog/2011/04/mirbase-17-released/
2. How to identify differentially expressed genes?
This parameter may need to be consulted during filtering. Generally, if the focus is on identifying differentially expressed genes, all values should be retained; if the focus is on differential expression, only high- and medium-copy-number genes can be kept. A log2(Treat/Control) value greater than 0 indicates upregulation, with 1 corresponding to a two-fold increase, and 0 also indicating upregulation—specifically, a one-fold increase.
3. What are the advantages of the ACGT101 program?
The advantages are as follows:
1) Analyze the full-length sequence while simultaneously accounting for the sequencing quality score (Phred score);
2) Prior to comparing with reported mature sequences, perform a comparison against the reported precursor sequences. In addition to identifying entirely novel miRNA sequences, this approach can also reveal mature sequences at the other end of the precursor, as well as flanking miRNA sequences of previously reported mature forms.
3) Alignment-based filtering against other RNA databases, performed after alignment to the miRBase database, prevents the removal of reported miRNAs that map only sparsely to coding regions.
4) Table 5 presents rich and comprehensive data, with all results fully traceable.
5) 100 customer reference articles.
Original article link: HeYuan Bio – miRNA Sequencing
 Telephone consultation


